Best product analytics tools for startups: a seven-day comparison

A product analytics tool should help a startup answer a specific question: Do people reach the product’s first useful outcome, and do they come back? A pageview chart cannot answer that on its own. Nor can a beautiful funnel built from events that fire twice, fire on page load, or lose the user between signup and first use.
This comparison looks at PostHog, Mixpanel and Amplitude through one small-team trial. Their public product pages, checked September 25, 2026, describe different ways to explore behavior. We have not run a controlled hands-on benchmark, and this is not a universal ranking. Use the same sample workflow in each candidate and verify current features, plan limits and data terms on the vendor’s own site before committing.
If your immediate problem is acquiring the first relevant visitors, start with our SaaS marketing channels matrix. Product analytics becomes useful when you can define what a visitor or user should do next.
Define the decision before you choose software
Write a sentence your founder and product teammate would both accept: “Of people who create an account, how many complete the first useful action within seven days?” Replace “first useful action” with a real product event such as publishing a page, inviting a teammate, or finishing the first report. An email click or button press can be a step; it is rarely proof of value by itself.
Use three separate measures:
Before installing a new SDK, define the event name, when it fires, who owns it and what makes it invalid. Keep a small sample of consented or synthetic test users so you can check every event against the actual action. Do not place real customer identifiers in a vendor trial until you have reviewed access, retention and privacy terms.
PostHog
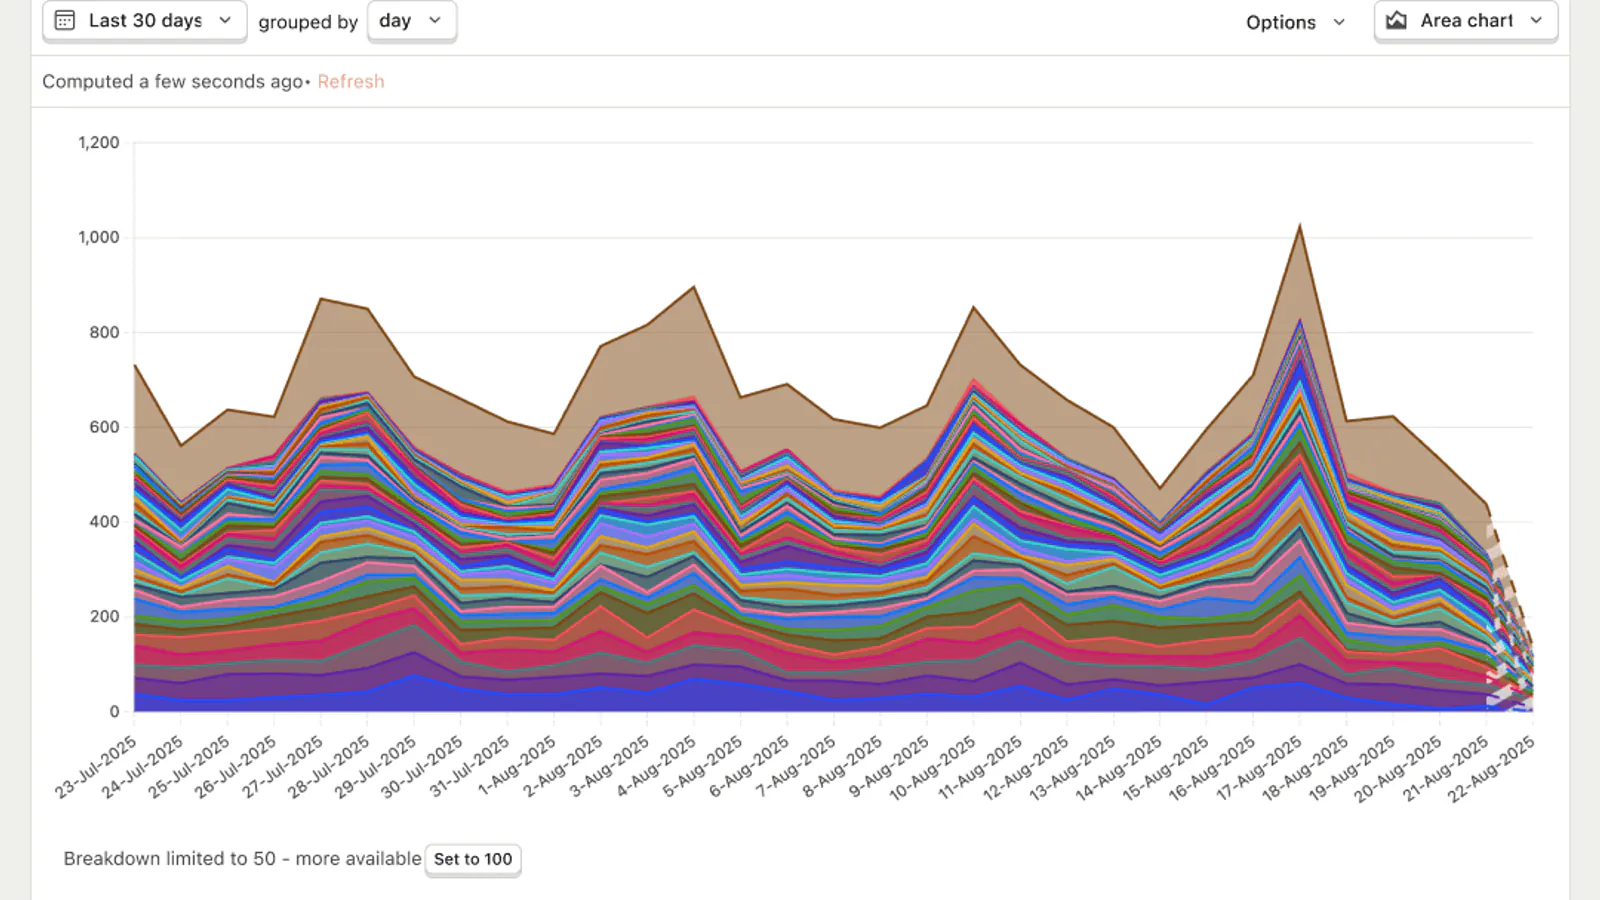
PostHog’s public Product Analytics page describes web autocapture, trends, funnels, retention, paths and the ability to inspect a session replay behind a data point. That combination is worth trying when a technical founder wants to move from a failed step to the behavior around it. Autocaptured clicks still need a deliberate event definition for the outcome you actually care about.
In your trial, instrument signup_completed and one real first-value event. Build a funnel from signup to value, then inspect several sample sessions for the step that fails. Check whether replay access and identity resolution match your privacy rules. PostHog’s public trend image shown here is a vendor example, captured September 25, 2026; it is not SEO Directory’s data or a verified customer result. Check PostHog’s current product and pricing information before adopting it.
Create a product draft, review every fact, and choose a free listing with a verified badge or a one-time badge-free listing after review.
See submission options →
Mixpanel
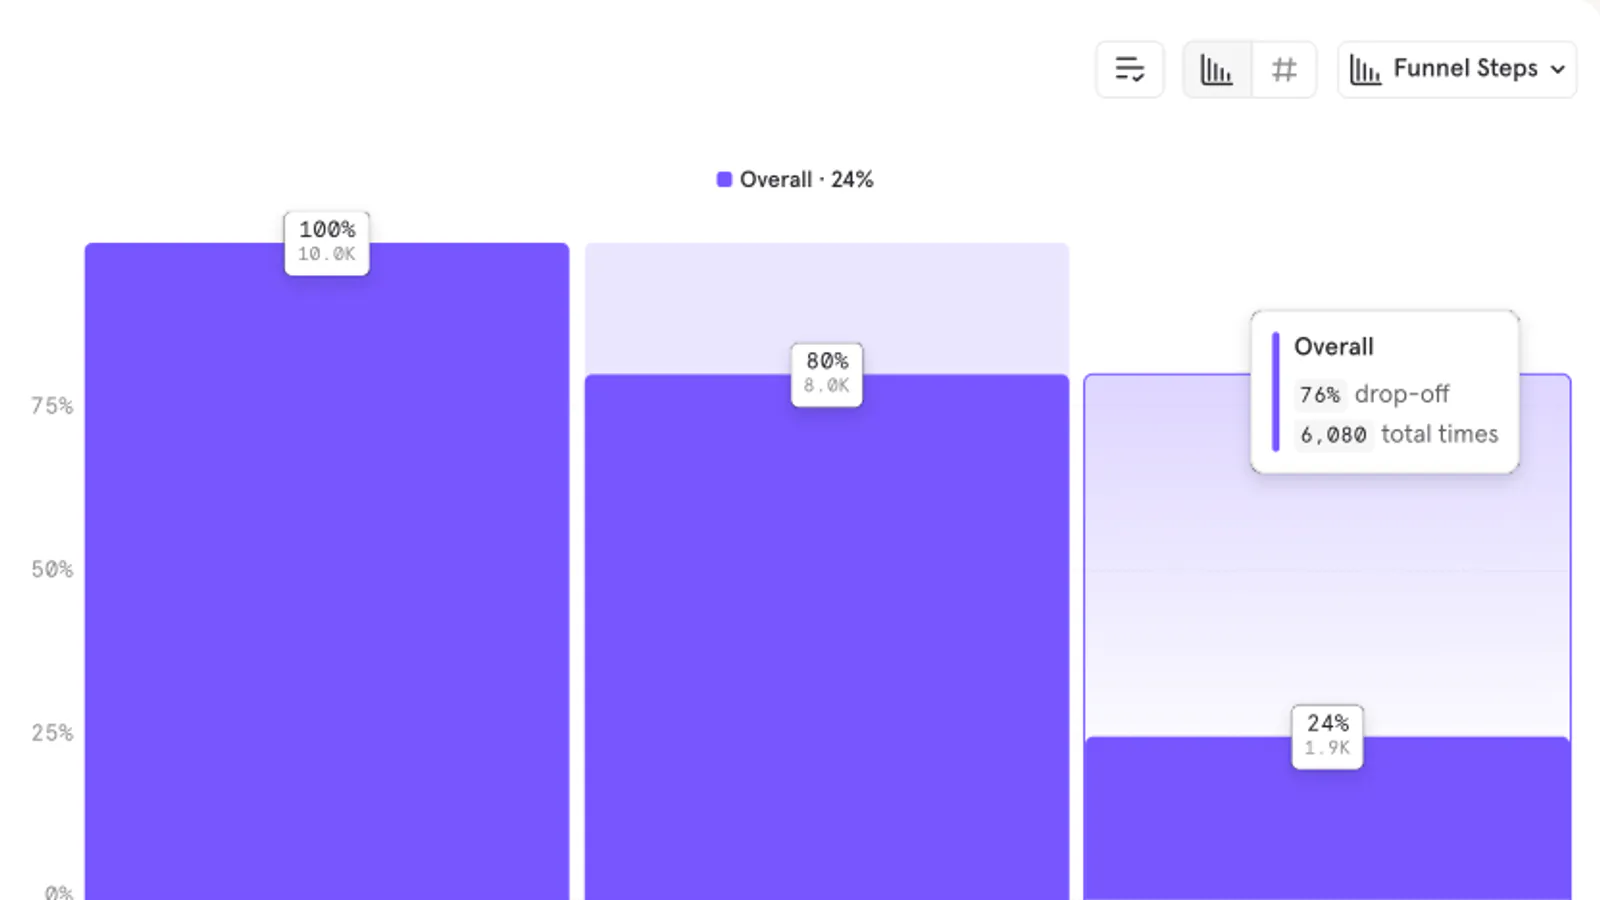
Mixpanel’s public Product Analytics page presents behavioral funnels, engagement and cohort analysis. It is a candidate when the team’s main job is to segment a clearly defined funnel and compare what different user groups do after a release. A segment is only useful if its event and user definitions are stable.
In the trial, build the same signup-to-value funnel for a new-user cohort and a returning-user cohort. Ask a teammate to reproduce the answer without your saved dashboard. If your definitions of “new,” “active,” or “converted” differ, settle that before comparing tools. The inline funnel graphic is an official public Mixpanel example captured September 25, 2026; its numbers are sample marketing content, not a claim about your product. Review the current Mixpanel page and live plan terms before choosing.
Amplitude
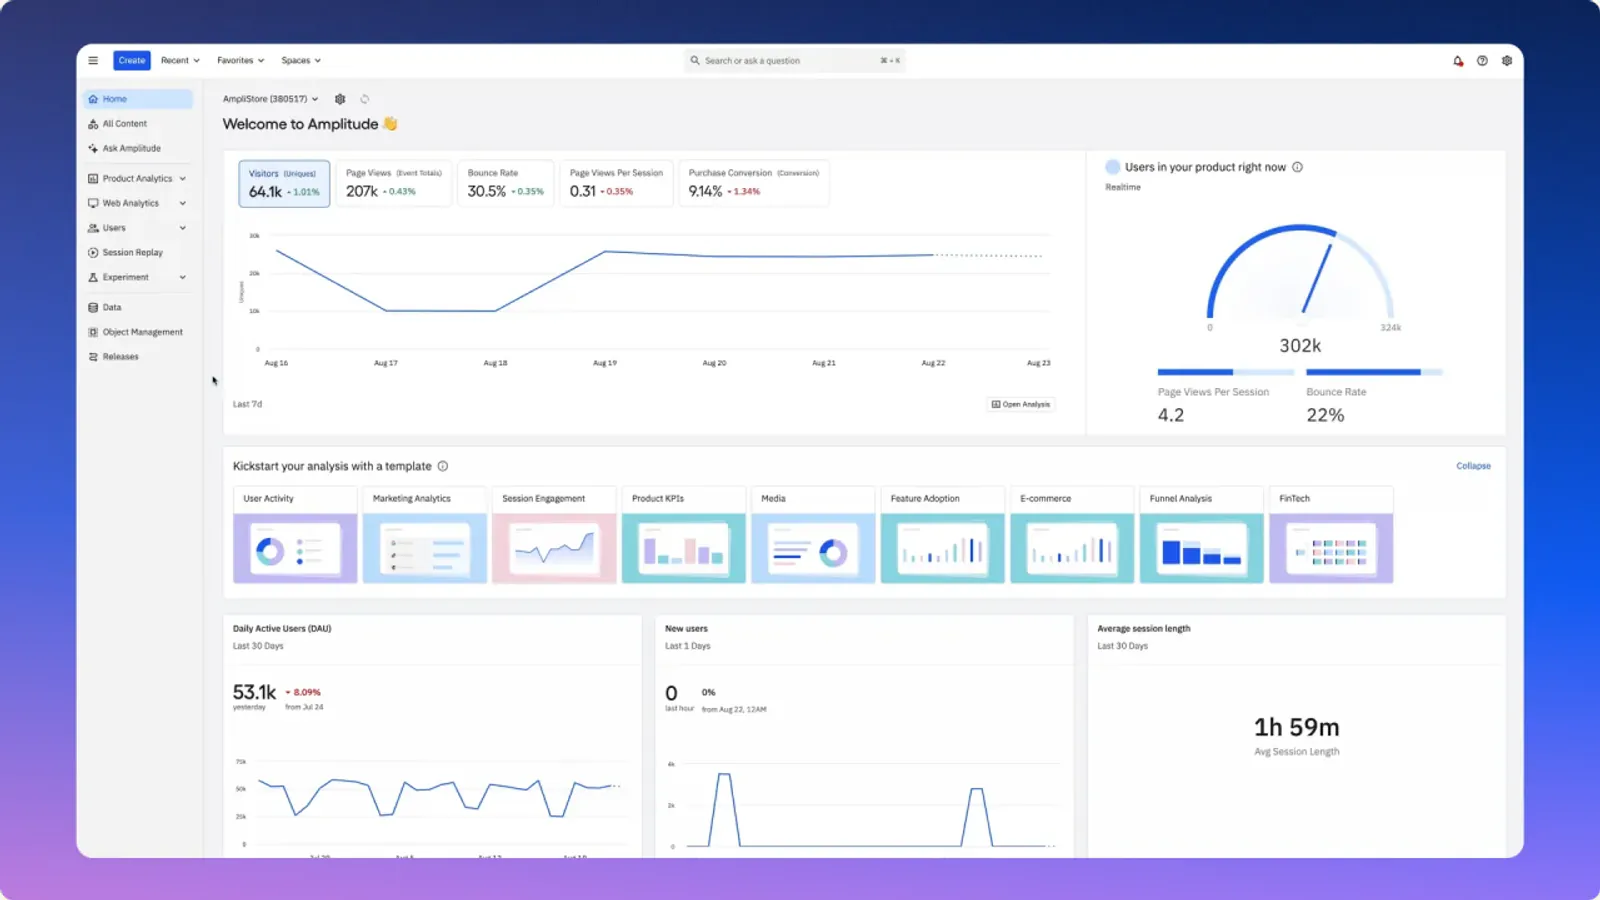
Amplitude’s public Product Analytics page describes conversion, retention and feature-engagement analysis, along with starter templates and reporting views. It is worth testing when the key decision is not just which step loses users, but which group returns and repeats a meaningful behavior. Start with one cohort definition rather than filling a dashboard with unrelated charts.
In the trial, compare first-week return behavior for users who reached the first useful action and those who did not. Check whether both groups were identified consistently across devices or sessions. A difference is a prompt to investigate, not proof that one feature caused retention. The inline demo frame is from Amplitude’s public product page, captured September 25, 2026; it is a promotional sample interface. Verify Amplitude’s current product scope and pricing yourself.
Which product analytics tool for startups has a free tier?
All three tools in this comparison advertise a continuing free plan on their PostHog, Mixpanel and Amplitude pricing pages, checked September 25, 2026. A free plan is useful for the seven-day test below, but the advertised event allowance alone does not tell you whether the reports, retention period, exports and privacy controls you need are included.
These are vendor-stated terms, not prices we negotiated or features we benchmarked. Event caps count events, not people: one user can trigger many events. Estimate your monthly event volume from a real sample, record which exact report your second teammate can reproduce on the free plan, and inspect what happens at the limit. If a feature only works during a trial or paid upgrade, score that separately. Recheck the linked pricing pages before choosing because vendors can change limits.
Create a product draft, review every fact, and choose a free listing with a verified badge or a one-time badge-free listing after review.
See submission options →
Run the same seven-day test in each tool
Choose one product journey and a pass condition before opening the dashboards. For example: “A second teammate can accurately report the number of new accounts that completed the first project, identify the largest drop-off and reproduce five sampled user journeys.” This is a proposed internal test, not a performance promise from any vendor.
signup_completed, one first-value event and one repeat-value event. Specify the firing action, expected user ID and owner for each.Score each tool on answerability, data quality, team usability, privacy fit, maintenance burden and expected cost. If all three fail on data quality, fix the event plan before buying more analytics.
Choose a tool from the evidence you can reproduce
Try PostHog first if moving from funnel drop-off into adjacent session context is the question you need to answer. Try Mixpanel first if segmentation and repeatable cohort funnels are the daily job. Try Amplitude first if retention and feature engagement across cohorts are central to the decision. These are starting hypotheses based on current public product positioning, not a claim that one product is objectively better or cheaper.
Keep a short decision note: the exact question, the event definitions, the number a second teammate reproduced, any privacy limitation and the expected cost at your own volume. That note will still be useful if you switch vendors later. If the team cannot define the first useful action yet, a lean marketing and measurement plan can help you name the outcome before adding instrumentation.
Building an analytics tool or another useful startup product? Submit your software to SEO Directory for independent review. The current free route requires badge verification, and the paid badge-free route still requires review. Submission does not guarantee approval, search ranking, visitors or customers. PostHog, Mixpanel and Amplitude are compared from their public sites here; this article does not imply they are listed or endorsed in the directory.
Create a product draft, review every fact, and choose a free listing with a verified badge or a one-time badge-free listing after review.
See submission options →